Bardell Real Estate Logo

December 2020 home sales report

December 2020 home sales report

WASHINGTON (January 22, 2021) – December 2020 home sales report rose reaching their highest level since 2006, according to the National Association of Realtors®. Activity in the major regions was mixed on a month-over-month basis, but each of the four areas recorded double-digit year-over-year growth in December.

December 2020 Existing-Home Sales


Total existing-home sales,1 https://www.nar.realtor/existing-home-sales, completed transactions that include single-family homes, townhomes, condominiums and co-ops, increased 0.7% from November to a seasonally-adjusted annual rate of 6.76 million in December. Sales in total rose year-over-year, up 22.2% from a year ago (5.53 million in December 2019).

“December 2020 home sales report we saw sales perform at their highest levels since 2006, despite the pandemic,” said Lawrence Yun, NAR’s chief economist. “What’s even better is that this momentum is likely to carry into the new year, with more buyers expected to enter the market.”

Yun predicts a continuation of the strong activity that’s currently taking place in the housing market and in the overall economy.

“Although mortgage rates are projected to increase, they will continue to hover near record lows at around 3%,” Yun said. “Moreover, expect economic conditions to improve with additional stimulus forthcoming and vaccine distribution already underway.”

The median existing-home price2 for all housing types in December was $309,800, up 12.9% from December 2019 ($274,500), as prices increased in every region. December’s national price increase marks 106 straight months of year-over-year gains.

Total housing inventory3 at the end of December totaled 1.07 million units, down 16.4% from November and down 23% from one year ago (1.39 million). Unsold inventory sits at an all-time low 1.9-month supply at the current sales pace, down from 2.3 months in November and down from the 3.0-month figure recorded in December 2019. NAR first began tracking the single-family home supply in 1982.

Properties typically remained on the market for 21 days in December, seasonally even with November and down from 41 days in December 2019. Seventy percent of the homes sold in December 2020 were on the market for less than a month.

“To their credit, homebuilders and construction companies have increased efforts to build, with housing starts hitting an annual rate of near 1.7 million in December, with more focus on single-family homes,” Yun said. “However, it will take vigorous new home construction in 2021 and in 2022 to adequately furnish the market to properly meet the demand.”

First-time buyers were responsible for 31% in the December 2020 home sales report, unchanged from the same time in 2019, but down from 32% in November 2020. NAR’s 2020 Profile of Home Buyers and Sellers – released in late 20204 – revealed that the annual share of first-time buyers was 31%.

Individual investors or second-home buyers, who account for many cash sales, purchased 14% of homes in December, identical to the share recorded in November 2020 and a small decline from 17% in December 2019. All-cash sales accounted for 19% of transactions in December, down from 20% in both November and December 2019.

Distressed sales5 – foreclosures and short sales – represented less than 1% of sales in December, equal to November’s percentage but down from 2% in December 2019.

“NAR will work with the incoming Biden administration in pursuit of policies promoting housing affordability and accessibility,” said NAR President Charlie Oppler, a Realtor® from Franklin Lakes, N.J., and the CEO of Prominent Properties Sotheby’s International Realty. “We were pleased with the homebuyer tax credit President Biden proposed as a candidate and we look forward to continuing our work with Congress and the White House. We will aim to find common ground, especially related to ways of boosting home supply and working toward solutions that will protect and support homeownership and America’s broader real estate industry.”

According to Freddie Mac, the average commitment rate(link is external) for a 30-year, conventional, fixed-rate mortgage decreased to 2.68% in December, down from 2.77% in November. The average commitment rate across all of 2020 was 3.11%.

Single-family home sales rose at a seasonally-adjusted annual rate of 6.03 million in December, up 0.7% from 5.99 million in November, and up 22.8% from one year ago. The median existing single-family home price was $314,300 in December, up 13.5% from December 2019.

Single-family and Condo/Co-op Sales

Existing condominium and co-op sales were recorded at a seasonally-adjusted annual rate of 730,000 units in December, up 1.4% from November and up 17.7% from one year ago. The median existing condo price was $272,200 in December, an increase of 6.9% from a year ago.

Regional Breakdown

Median home prices increased at double-digit rates in each of the four major regions from one year ago.

December 2020 saw existing-home sales in the Northeast climb 4.5%, recording an annual rate of 930,000, a 27.4% increase from a year ago. The median price in the Northeast was $362,100, up 19.0% from December 2019.

Existing-home sales in the Midwest were unchanged, recording an annual rate of 1,590,000 in December, but up 26.2% from a year ago. The median price in the Midwest was $235,700, a 13.7% increase from December 2019.

Existing-home sales in the South increased 1.1% to an annual rate of 2,860,000 in December, up 20.7% from the same time one year ago. The median price in the South was $268,100, an 11.3% increase from a year ago.

Existing-home sales in the West fell 1.4% from the month prior, recording an annual rate of 1,380,000 in December, a 17.9% increase from a year ago. The median price in the West was $467,900, up 14.2% from December 2019.

The National Association of Realtors® is America’s largest trade association, representing more than 1.4 million members involved in all aspects of the residential and commercial real estate industries.

For local information, please contact the local association of Realtors® for data from local multiple listing services (MLS). Local MLS data is the most accurate source of sales and price information in specific areas, although there may be differences in reporting methodology.

NOTE: NAR’s Pending Home Sales Index for December is scheduled for release on January 29, and Existing-Home Sales for January will be released February 19; release times are 10:00 a.m. ET.


1 Existing-home sales, which include single-family, townhomes, condominiums and co-ops, are based on transaction closings from Multiple Listing Services. Changes in sales trends outside of MLSs are not captured in the monthly series. NAR rebenchmarks home sales periodically using other sources to assess overall home sales trends, including sales not reported by MLSs.

December 2020 home sales report is based on closings, differ from the U.S. Census Bureau’s series on new single-family home sales, which are based on contracts or the acceptance of a deposit. Because of these differences, it is not uncommon for each series to move in different directions in the same month. In addition, existing-home sales, which account for more than 90% of total home sales, are based on a much larger data sample – about 40% of multiple listing service data each month – and typically are not subject to large prior-month revisions.

The annual rate for a particular month represents what the total number of actual sales for a year would be if the relative pace for that month were maintained for 12 consecutive months. Seasonally adjusted annual rates are used in reporting monthly data to factor out seasonal variations in resale activity. For example, home sales volume is normally higher in the summer than in the winter, primarily because of differences in the weather and family buying patterns. However, seasonal factors cannot compensate for abnormal weather patterns.

Single-family data collection began monthly in 1968, while condo data collection began quarterly in 1981; the series were combined in 1999 when monthly collection of condo data began. Prior to this period, single-family homes accounted for more than nine out of 10 purchases. Historic comparisons for total home sales prior to 1999 are based on monthly single-family sales, combined with the corresponding quarterly sales rate for condos.

2 The median price is where half sold for more and half sold for less; medians are more typical of market conditions than average prices, which are skewed higher by a relatively small share of upper-end transactions. The only valid comparisons for median prices are with the same period a year earlier due to seasonality in buying patterns. Month-to-month comparisons do not compensate for seasonal changes, especially for the timing of family buying patterns. Changes in the composition of sales can distort median price data. Year-ago median and mean prices sometimes are revised in an automated process if additional data is received.

The national median condo/co-op price often is higher than the median single-family home price because condos are concentrated in higher-cost housing markets. However, in a given area, single-family homes typically sell for more than condos as seen in NAR’s quarterly metro area price reports.

3 Total inventory and month’s supply data are available back through 1999, while single-family inventory and month’s supply are available back to 1982 (prior to 1999, single-family sales accounted for more than 90% of transactions and condos were measured only on a quarterly basis).

4 Survey results represent owner-occupants and differ from separately reported monthly findings from NAR’s Realtors® Confidence Index, which include all types of buyers. Investors are under-represented in the annual study because survey questionnaires are mailed to the addresses of the property purchased and generally are not returned by absentee owners. Results include both new and existing homes.

Ready to make a Move?

Bardell Real Estate are the experts in helping you with your selling, buying or renting needs near Orlando, Florida. Make your Disney area experience a forever memorable one. Call us now to speak to a real estate agent.

[formlift id=”36911″]

It may be the right time to sell!

It may be the right time to sell!

It may be the right time to sell!

Time to sell your home time clockThings are coming to a boil in the market for U.S. homes, and it may be the right time to sell.

In October, prices for houses across the U.S. registered the fifth-largest monthly gain since 1996 and the strongest in 15 years. The heat is coming from a mix of factors, including limited inventory, suburban migration and rock-bottom interest rates.

According to a recent report from the Federal Housing Finance Agency, U.S. home prices rose 7.8% in the 12 months ended September 30, the fastest climb in more than a decade. The typical U.S. home appreciated by 1% in October alone, to $262,604, the best monthly gain since the summer and fall of 2005.

“This is some of the fastest home price appreciation in the modern era,” says Jeff Tucker, a senior economist at Zillow, which compiled the data on October’s spike. “I don’t think this pace of appreciation can go on forever. It’s just too hot.”

Leading the way are non-coastal states out West; Idaho jumped the most, with a year-over-year increase of 14.4%. That surge was fueled by Boise, where values have surged for decades, as the city offers the amenities of West Coast hot spots like Seattle but at a more affordable price. Since 1991, the median Boise home has appreciated 391%, according to the FHFA, one of the biggest jumps in the country.

Trailing Idaho is Arizona, with an 11.1% year-over-year gain, but for different reasons: Snowbirds are flocking to Florida. Washington State (10.8%) and Utah (10.7%) follow close behind. At the bottom of the list are Alaska and Hawaii, though even in those places homes have gained about 5%.

Orlando Real Estate Market Trends

According to the national real estate brokerage, Redfin, the Orlando housing market is very competitive. Homes in Orlando receive 3 offers on average and sell in around 17 days. The average sale price of a home in Orlando was $284,000 last month, up 7.1% since last year. The average sale price per square foot in Orlando is $163, up 7.9% since last year. Hot homes can sell for around list price and go pending in just 5 days.

LISTING PRICES

According to Realtor.com November 2020 market report, Orlando is a seller’s market report, which means that more people are looking to buy than there are homes available.

  • The median list price of homes in Orlando, FL was $275K, trending up 1.9% year-over-year.
  • The median listing price per square foot was $165.
  • The median sale price was $277K.
  • Sale-to-List Price Ratio: 98.64% — a seller would always prefer scenarios that can yield a ratio of 100% or higher while a buyer would prefer a sale to ask price ratio that’s closer to 90%.
  • On average, homes in Orlando, FL sell after 57 days on the market.
  • The trend for median days on market in Orlando, FL has gone down since last month, and slightly down since last year.
  • Lake Nona South has a median listing price of $564.5K, making it the most expensive neighborhood.
  • South Semoran is the most affordable neighborhood, with a median listing price of $120K.

Time to sell your Home?

Bardell Real Estate are the experts in helping you with your selling, buying or renting needs near Orlando, Florida. Make your Disney area experience a forever memorable one. Call us now to speak to a real estate agent.

[formlift id=”36911″]

Online Closings are here!

Online Closings are here!

Online Closings are here!

Online Closings benefits 
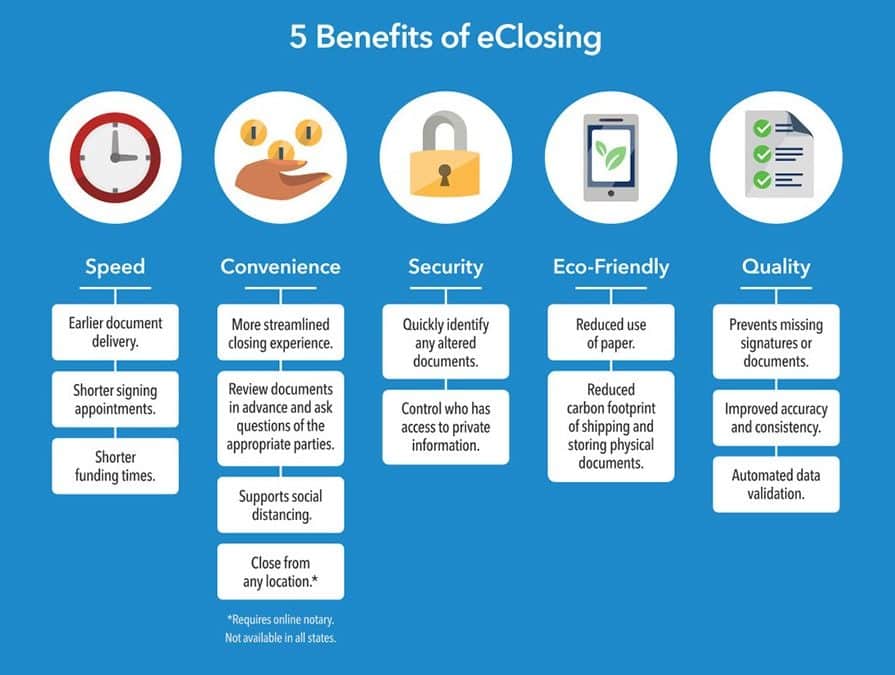
Online Closings are here! Learn about digital closings and how to get your practice ready. Real estate closings will change over the next 2-3 years and move in the direction of less paper and more technology. Lenders are recognizing the efficiency and cost savings associated with processing loans digitally. Consumers are getting much more comfortable conducting business digitally. Our state has joined the movement by authorizing Remote Online Notarization (RON) effective Jan. 1, 2020. Creating a better closing experience while reducing risks for all parties. But this transformation must be carefully managed to avoid a negative impact on land ownership records and the mortgage finance engine driving our nation’s economy and personal wealth. Title companies are developing innovative and secure ways to improve the closing experience for our customers.


What is RON?

It is an acronym for remote online notarization. RON is the means used to electronically notarize a document using a third-party (i.e. vendor) software platform which records the visual and audio communications of participants to the signing of a document even when the participants are not physically located in the same place. The practice was authorized in Florida on Jan. 1, 2020.


How does RON differ from “electronic notarization”?

Electronic notarization, first authorized in Florida in 2007, allows for the notarization of electronic documents by a notary public using an electronic signature and applying an electronic seal. Unlike RON, the principal must be in the same location as the notary public, the computer or other electronic device need not be connected to the internet, and there is no requirement that the notarization procedure be recorded. Also, unlike RON, the notary need not maintain an activity journal and identity is confirmed by the notary through personal knowledge or presentation of a valid form of identification. Electronic notarization is governed by Sec. 117.021, F.

May the signatures of foreign nationals be notarized remotely or is it only available to U.S. citizens?

Although the RON law allows for the notarization of foreign nationals,  All signers must present a form of identification subject to verification. 

Do I need to obtain lender approval if the borrower wishes to sign the loan documents remotely via RON?

Check the written loan closing instructions and contact the lender for approval to close digitally and utilize RON.
 

Ready to make a Move?

Bardell Real Estate are the experts in helping you with your selling, buying or renting needs near Orlando, Florida. Make your Disney area experience a forever memorable one. Call us now to speak to a real estate agent.

[formlift id=”36911″]

272 Calabay Parc Just Closed

272 Calabay Parc Just Closed

272 CALABAY PARC BOULEVARD, DAVENPORT, FL

Just Sold

$ Click for current price
5 BEDROOMS | 4 full baths BATHROOMS | 2835 SqFt

272 Calabay Parc Just Closed- You can find this spacious 5 bedroom 4 bathroom pool home in the quiet community of Calabay Parc located just off of Highway 27. Current owners have used it primarily as a second home so it is being sold fully furnished and would make a great family home, vacation home or snowbird retreat. The grand entrance to the home leads into the separate dining and living area, both with lots of natural light. The fully equipped kitchen offers a breakfast bar, separate breakfast nook and a closet pantry for extra storage. The master bedroom has a large en-suite with dual sinks, tub and separate shower and also has direct access to the pool deck. A second bedroom and house bathroom complete the downstairs accommodation. Upstairs you will find a second master bedroom with an en-suite along with two additional bedrooms and a house bathroom – the loft area is currently used as a games room but could easily be turned into a second living area or home office. The family room provides direct access via sliding glass doors to the covered pool deck – large enough for outdoor dining and the private inground pool area benefits from no immediate rear neighbors. Great location Within a short distance to Hwy 192, Champions Gate, Posner Park and I-4 leading to Central Florida’s most famous attractions, shopping Outlets.272 Calabay Parc Just Closed


1307 Casterton Dr-Just Sold!

1307 Casterton Dr-Just Sold!

1307 CASTERTON CIRCLE, DAVENPORT, FL

Just Sold

$ Click for current price
4 BEDROOMS | 3 full baths BATHROOMS | 1905 SqFt


1307 Casterton Dr-Just Sold! Looking for your forever home, investment property or home away from home? Look no further this home is what you’ve been looking for. Pride of ownership shows through as you enter the home into small tiled entrance hall which opens up into a formal living and dining room area. Through the archway in the dining room is the spacious kitchen with stainless appliances and granite counter tops offering a modern yet practical kitchen with breakfast bar. Adjoining the kitchen is the breakfast room and family room which overlooks the pool area through sliding glass doors. The master bedroom is off the family room and also overlooks the pool area. On the opposite side of the family room is a corridor leading to two guest bedrooms with twins beds. The family bathroom sits between these two guest rooms providing easy access both day and night. This home has a second master bedroom with smaller ensuite bathroom situated at the end of the corridor. This home benefits from a new roof in 2018, new pool heater in 2020, newly installed carpets and granite counter tops. Garage used as a games room but can convert back to garage. Located in the popular gated community of Westridge. This community offers clubhouse and amenities for the owner and their guests as well as being a short ride to Disney, grocery stores, restaurants, I4, Hwy 192 etc. Don’t delay! Sold fully furnished, call today or you will miss the chance of owning this beautiful home.1307 Casterton Dr-Just Sold!