by Marketing | Feb 26, 2025 | Blog, Homeowners, Homes, Villas and Condos, Investment Property in Florida, Just Sold, Local Events, Long Term Rental, Mortgages, New Construction, New Listing, News, Property for Sale, Property for Sale in Orlando, Property Management, Real Estate Components, Real Estate News, Retirement / 55+, Uncategorized, Vacant Lot
6 Common Myths About FHA Loans As home prices continue to rise, more buyers are considering Federal Housing Administration (FHA) loans to make homeownership more accessible. FHA loans are government-backed mortgages known for their flexible lending criteria, making...
by Front Office | Feb 26, 2025 | Blog, Buyers, Homeowners, Homes, Villas and Condos, Investment Property in Florida, Just Sold, Long Term Rental, Mortgages, New Construction, New Listing, New Rental Listings, News, Press Releases, Property for Sale, Property for Sale in Orlando, Property Management, Real Estate Components, Real Estate News, Renters, Retirement / 55+, Sellers, Things to Do in Orlando, Uncategorized, Vacant Lot
7 Home Buyer & Seller Market Trends to Watch in 2025 7 Key Real Estate Trends to Watch in 2025 As we step into 2025, the real estate market continues to change, bringing both new opportunities and challenges for buyers, sellers, and industry professionals. Based...
by Elsa Soto | Apr 23, 2021 | Blog, Mortgages, News, Real Estate Components, Real Estate News
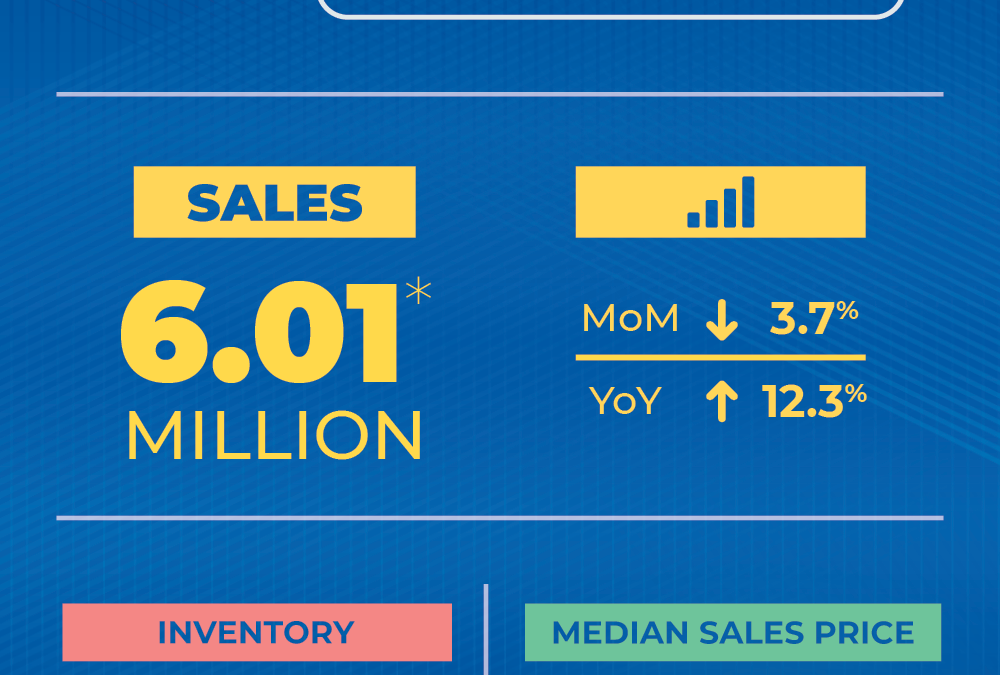
Housing Market Report-March WASHINGTON (April 22, 2021) – Existing-home sales fell in March, marking two consecutive months of declines, according to the National Association of Realtors®. The month of March saw record-high home prices and gains. While each of the...
by Elsa Soto | Feb 26, 2021 | Blog, Homeowners, Homes, Villas and Condos, Investment Property in Florida, Real Estate Components, Real Estate News
January Homes Sales Recap WASHINGTON (February 19, 2021) – January Homes Sales Recap Marks two consecutive months of growth, according to the National Association of Realtors®. From a month-over-month perspective, buying activity varied in the major regions....
by Elsa Soto | Jan 29, 2021 | Blog, Buyers, Renters, Retirement / 55+
9000 US Hwy 192 #488 Just listed 9000 US Highway 192 #488, Clermont, FL For Sale Description Photos Maps & Local Print Follow This Home Search All Homes For Sale Free Home Values Presented By: Showing Agent: Bardell Real Estate Bardell Real Estate863-424-2309 ...