April Existing-home sales Report
April Existing-home sales Report
 WASHINGTON (May 21, 2021) – Existing-home sales waned in April, marking three straight months of declines, according to the National Association of Realtors®. All but one of the four major U.S. regions witnessed month-over-month drops in home sales, but each registered double-digit year-over-year gains for April.
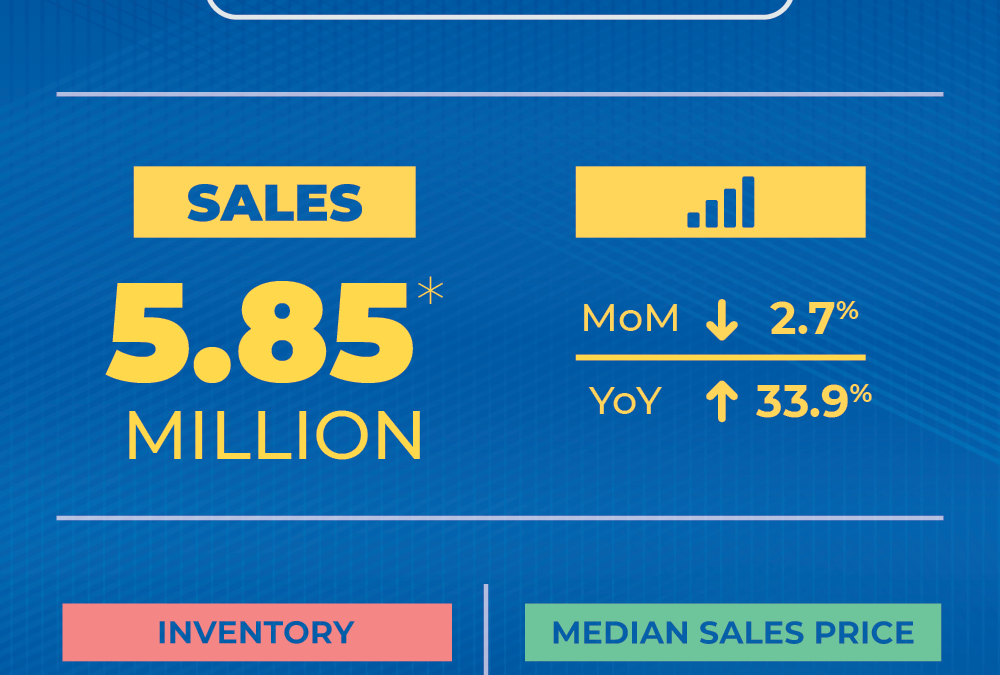
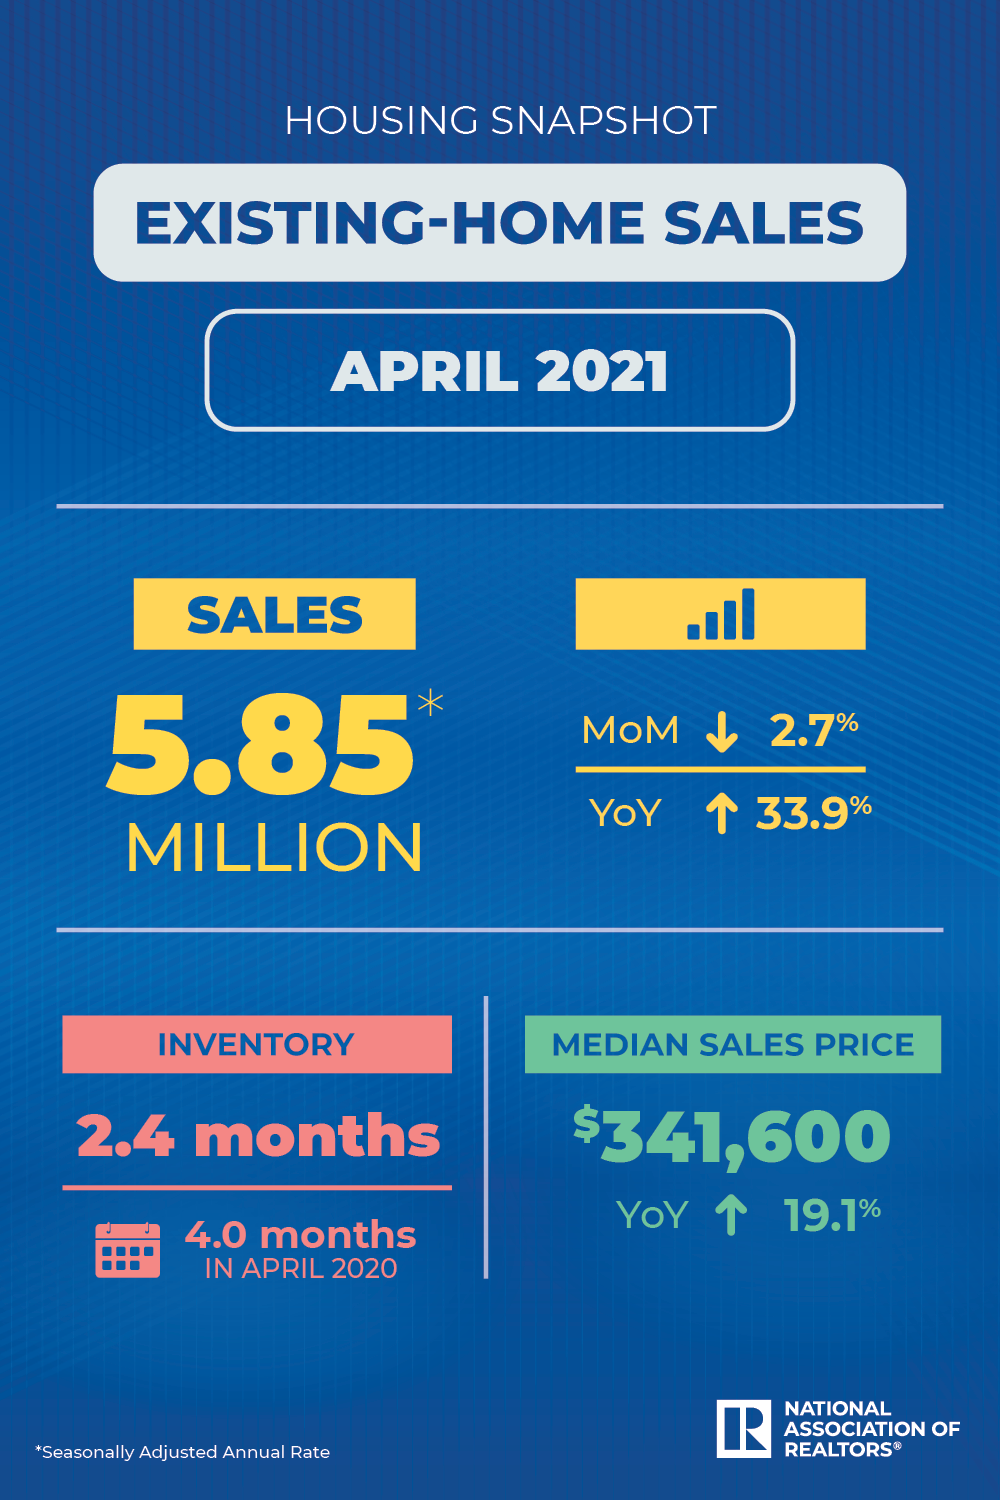
Total existing-home sales,1 https://www.nar.realtor/existing-home-sales, completed transactions that include single-family homes, townhomes, condominiums and co-ops, slipped 2.7% from March to a seasonally-adjusted annual rate of 5.85 million in April. Sales overall jumped year-over-year, up 33.9% from a year ago (4.37 million in April 2020).
“Home sales were down again in April from the prior month, as housing supply continues to fall short of demand,” said Lawrence Yun, NAR’s chief economist. “We’ll see more inventory come to the market later this year as further COVID-19 vaccinations are administered and potential home sellers become more comfortable listing and showing their homes. The falling number of homeowners in mortgage forbearance will also bring about more inventory.
“Despite the decline, housing demand is still strong compared to one year ago, evidenced by home sales from this January to April, which are up 20% compared to 2020,” Yun continued. “The additional supply projected for the market should cool down the torrid pace of price appreciation later in the year.”
The median existing-home price2 for all housing types in April was $341,600, up 19.1% from April 2020 ($286,800), as every region recorded price increases. This is a record high and marks 110 straight months of year-over-year gains.
Total housing inventory3 at the end of April amounted to 1.16 million units, up 10.5% from March’s inventory and down 20.5% from one year ago (1.46 million). Unsold inventory sits at a 2.4-month supply at the current sales pace, slightly up from March’s 2.1-month supply and down from the 4.0-month supply recorded in April 2020. These numbers continue to represent near-record lows. NAR first began tracking the single-family home supply in 1982.
Properties typically remained on the market for 17 days in April, down from 18 days in March and from 27 days in April 2020. Eighty-eight percent of the homes sold in April 2021 were on the market for less than a month.
First-time buyers were responsible for 31% of sales in April, down from 32% in March and 36% in April 2020. NAR’s 2020 Profile of Home Buyers and Sellers – released in late 20204 – revealed that the annual share of first-time buyers was 31%.
“First-time buyers in particular are having trouble securing that first home for a multitude of reasons, including not enough affordable properties, competition with cash buyers and properties leaving the market at such a rapid pace,” Yun said.
Individual investors or second-home buyers, who account for many cash sales, purchased 17% of homes in April, up from 15% in March and 10% in April 2020. All-cash sales accounted for 25% of transactions in April, up from both 23% in March and 15% in April 2020.
Distressed sales5 – foreclosures and short sales – represented less than 1% of sales in April, equal to March’s percentage but down from 3% in April 2020.
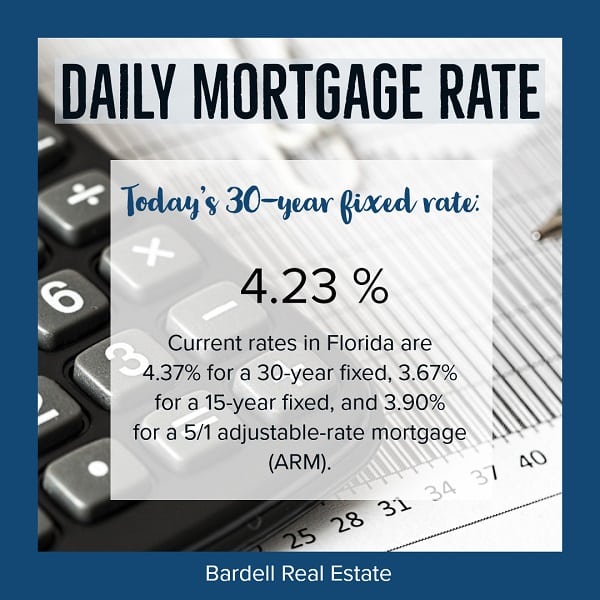
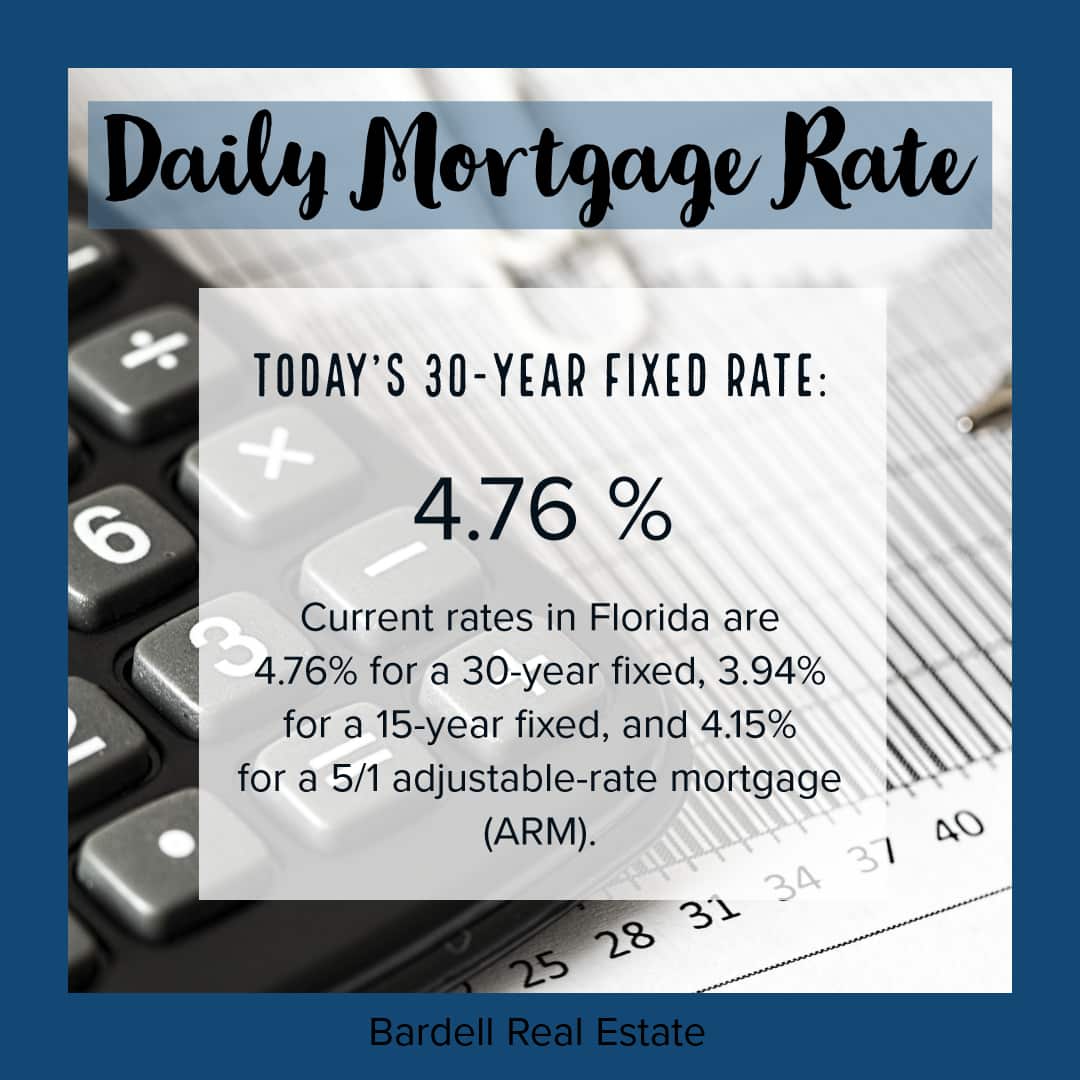
According to Freddie Mac, the average commitment rate(link is external) for a 30-year, conventional, fixed-rate mortgage was 3.06% in April, down from 3.08% in March. The average commitment rate across all of 2020 was 3.11%. Yun expects the 30-year fixed-rate mortgage to remain below 3.5% in 2021.
Single-family and Condo/Co-op Sales
Single-family home sales dropped to a seasonally-adjusted annual rate of 5.13 million in April, down 3.2% from 5.30 million in March, and up 28.9% from one year ago. The median existing single-family home price was $347,400 in April, up 20.3% from April 2020.
Existing condominium and co-op sales were recorded at a seasonally-adjusted annual rate of 720,000 units in April, up 1.4% from March and up 84.6% from one year ago. The median existing condo price was $300,400 in April, an increase of 12.6% from a year ago.
“The demand for homeownership in America is as strong as it’s ever been, and NAR continues working with policymakers across the country to find solutions to the issues we face in our industry,” said NAR President Charlie Oppler, a Realtor® from Franklin Lakes, N.J., and the CEO of Prominent Properties Sotheby’s International Realty. “Ultimately, though, buyers still recognize that securing a home is one of the best ways to build long-term wealth, and Realtors® continue their work to make that dream a reality for families everywhere.”
Realtor.com®’s Market Hotness Index(link is external), measuring time-on-the-market data and unique viewers per property, revealed that the hottest metro areas as of May 13 were Manchester, N.H.; Concord, N.H.; Lafayette, Ind.; Janesville, Wis.; and Elkhart, Ind.
Regional Breakdown
Only the Midwest experienced higher sales from the prior month, but each of the four major U.S. regions recorded year-over-year increases.
Existing-home sales in the Northeast fell 3.9% from March, but the annual rate of 730,000 represents a 30.4% leap from a year ago. The median price in the Northeast was $381,100, up 22.0% from April 2020.
Existing-home sales in the Midwest grew 0.8% to an annual rate of 1,290,000 in April, a 13.2% increase from a year ago. The median price in the Midwest was $259,300, a 13.5% rise from April 2020.
Existing-home sales in the South decreased 3.7%, recording an annual rate of 2,600,000 in April, up 39.0% from the same time one year ago. The median price in the South was $289,600, a 15.8% jump from one year ago.
Existing-home sales in the West declined 3.1% from the month prior, posting an annual rate of 1,230,000 in April, a 53.8% surge from a year ago. The median price in the West was $501,200, up 19.9% from April 2020.
The National Association of Realtors® is America’s largest trade association, representing more than 1.4 million members involved in all aspects of the residential and commercial real estate industries.
# # #
For local information, please contact the local association of Realtors® for data from local multiple listing services (MLS). Local MLS data is the most accurate source of sales and price information in specific areas, although there may be differences in reporting methodology.
NOTE: NAR’s Pending Home Sales Index for April is scheduled for release on May 27, and Existing-Home Sales for May will be released June 22; release times are 10:00 a.m. ET.
1 Existing-home sales, which include single-family, townhomes, condominiums and co-ops, are based on transaction closings from Multiple Listing Services. Changes in sales trends outside of MLSs are not captured in the monthly series. NAR rebenchmarks home sales periodically using other sources to assess overall home sales trends, including sales not reported by MLSs.
Existing-home sales, based on closings, differ from the U.S. Census Bureau’s series on new single-family home sales, which are based on contracts or the acceptance of a deposit. Because of these differences, it is not uncommon for each series to move in different directions in the same month. In addition, existing-home sales, which account for more than 90% of total home sales, are based on a much larger data sample – about 40% of multiple listing service data each month – and typically are not subject to large prior-month revisions.
The annual rate for a particular month represents what the total number of actual sales for a year would be if the relative pace for that month were maintained for 12 consecutive months. Seasonally adjusted annual rates are used in reporting monthly data to factor out seasonal variations in resale activity. For example, home sales volume is normally higher in the summer than in the winter, primarily because of differences in the weather and family buying patterns. However, seasonal factors cannot compensate for abnormal weather patterns.
Single-family data collection began monthly in 1968, while condo data collection began quarterly in 1981; the series were combined in 1999 when monthly collection of condo data began. Prior to this period, single-family homes accounted for more than nine out of 10 purchases. Historic comparisons for total home sales prior to 1999 are based on monthly single-family sales, combined with the corresponding quarterly sales rate for condos.
2 The median price is where half sold for more and half sold for less; medians are more typical of market conditions than average prices, which are skewed higher by a relatively small share of upper-end transactions. The only valid comparisons for median prices are with the same period a year earlier due to seasonality in buying patterns. Month-to-month comparisons do not compensate for seasonal changes, especially for the timing of family buying patterns. Changes in the composition of sales can distort median price data. Year-ago median and mean prices sometimes are revised in an automated process if additional data is received.
The national median condo/co-op price often is higher than the median single-family home price because condos are concentrated in higher-cost housing markets. However, in a given area, single-family homes typically sell for more than condos as seen in NAR’s quarterly metro area price reports.
3 Total inventory and month’s supply data are available back through 1999, while single-family inventory and month’s supply are available back to 1982 (prior to 1999, single-family sales accounted for more than 90% of transactions and condos were measured only on a quarterly basis).
4 Survey results represent owner-occupants and differ from separately reported monthly findings from NAR’s Realtors® Confidence Index, which include all types of buyers. Investors are under-represented in the annual study because survey questionnaires are mailed to the addresses of the property purchased and generally are not returned by absentee owners. Results include both new and existing homes.
5 Distressed sales (foreclosures and short sales), days on market, first-time buyers, all-cash transactions and investors are from a monthly survey for the NAR’s Realtors® Confidence Index, posted at nar.realtor.
Ready to make a Move?
Bardell Real Estate are the experts in helping you with your selling, buying or renting needs near Orlando, Florida. Make your Disney area experience a forever memorable one. Call us now to speak to a real estate agent.
[formlift id=”36911″]