 WASHINGTON (April 22, 2021) – Existing-home sales fell in March, marking two consecutive months of declines, according to the National Association of Realtors®. The month of March saw record-high home prices and gains. While each of the four major U.S. regions experienced month-over-month drops, all four areas welcomed year-over-year gains in home sales.
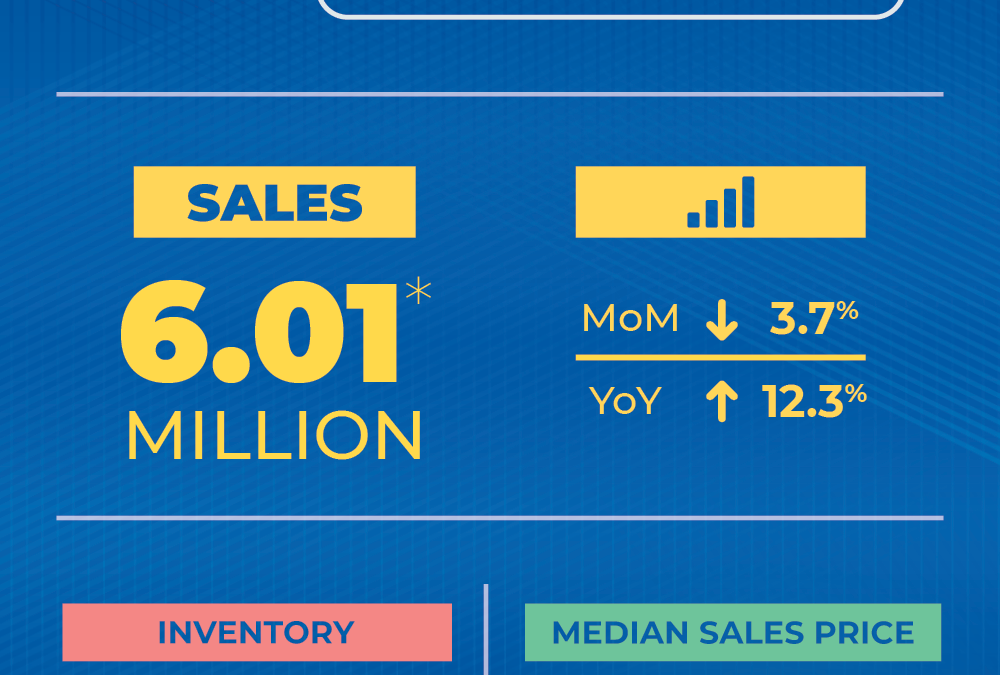
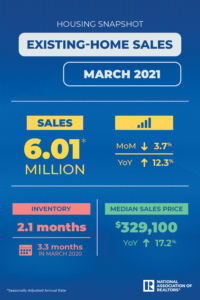
Total existing-home sales,1 https://www.nar.realtor/existing-home-sales, completed transactions that include single-family homes, townhomes, condominiums and co-ops, decreased 3.7% from February to a seasonally-adjusted annual rate of 6.01 million in March. Sales overall climbed year-over-year, up 12.3% from a year ago (5.35 million in March 2020).
“Consumers are facing much higher home prices, rising mortgage rates, and falling affordability, however, buyers are still actively in the market,” said Lawrence Yun, NAR’s chief economist.
“The sales for March would have been measurably higher, had there been more inventory,” he added. “Days-on-market are swift, multiple offers are prevalent, and buyer confidence is rising.”
Yun said although mortgage rates have risen a tick, they are still at a favorable level and the economic outlook is promising.
“At least half of the adult population has received a COVID-19 vaccination, according to reports, and recent housing starts and job creation data show encouraging dynamics of more supply and strong demand in the housing sector.”
The median existing-home price2 for all housing types in March was $329,100, up 17.2% from March 2020 ($280,700), as prices increased in every region. March’s national price jump marks 109 straight months of year-over-year gains.
Realtor.com®’s Market Hotness Index(link is external), measuring time-on-the-market data and listing views per property, revealed that the hottest metro areas in March were Manchester, N.H.; Concord, N.H.; Vallejo, Calif.; Burlington, N.C.; and Springfield, Ohio.
According to Freddie Mac, the average commitment rate(link is external) for a 30-year, conventional, fixed-rate mortgage was 3.08% in March, up from 2.81% in February. The average commitment rate across all of 2020 was 3.11%.
Total housing inventory3 at the end of March amounted to 1.07 million units, up 3.9% from February’s inventory and down 28.2% from one year ago (1.49 million). Unsold inventory sits at a 2.1-month supply at the current sales pace, marginally up from February’s 2.0-month supply and down from the 3.3-month supply recorded in March 2020. Inventory numbers continue to represent near-historic lows; NAR first began tracking the single-family home supply in 1982.
“Without an increase in supply, the society wealth division will widen with homeowners enjoying sizable equity gains while renters will struggle to become homeowners,” Yun said.
Properties typically remained on the market for 18 days in March, down from 20 days in February and from 29 days in March 2020. Eighty-three percent of the homes sold in March 2021 were on the market for less than a month.
First-time buyers were responsible for 32% of sales in March, up from 31% in February and down from 34% in March 2020. NAR’s 2020 Profile of Home Buyers and Sellers – released in late 20204 – revealed that the annual share of first-time buyers was 31%.
Individual investors or second-home buyers, who account for many cash sales, purchased 15% of homes in March, down from 17% in February and up from 13% in March 2020. All-cash sales accounted for 23% of transactions in March, up from both 22% in February and from 19% in March 2020.
Distressed sales5 – foreclosures and short sales – represented less than 1% of sales in March, equal to February’s percentage but down from 3% in March 2020.
Single-family and Condo/Co-op Sales
Single-family home sales decreased to a seasonally-adjusted annual rate of 5.30 million in March, down 4.3% from 5.54 million in February, and up 10.4% from one year ago. The median existing single-family home price was $334,500 in March, up 18.4% from March 2020.
Existing condominium and co-op sales were recorded at a seasonally-adjusted annual rate of 710,000 units in March, up 1.4% from February and up 29.1% from one year ago. The median existing condo price was $289,000 in March, an increase of 9.6% from a year ago.
“NAR has made it a priority to be at the forefront of the anticipated economic revival,” said NAR President Charlie Oppler, a Realtor® from Franklin Lakes, N.J., and the CEO of Prominent Properties Sotheby’s International Realty. “We will continue pushing for an increase in housing construction and inventory, with the goal of helping qualified buyers and countless families achieve the American Dream of homeownership.”
Regional Breakdown
In comparison to one year ago, median home prices rose in each of the four major regions.
March 2021 saw existing-home sales in the Northeast slip 1.3%, recording an annual rate of 760,000, a 16.9% jump from a year ago. The median price in the Northeast was $364,800, up 21.4% from March 2020.
Existing-home sales in the Midwest declined 2.3% to an annual rate of 1,280,000 in March, a 0.8% rise from a year ago. The median price in the Midwest was $248,200, a 13.5% increase from March 2020.
Existing-home sales in the South dropped 2.9%, recording an annual rate of 2,700,000 in March, up 15.9% from the same time one year ago. The median price in the South was $283,900, a 15.6% climb from a year ago.
Existing-home sales in the West fell 8.0% from the month prior, posting an annual rate of 1,270,000 in March, a 15.5% rise from a year ago. The median price in the West was $493,300, up 16.8% from March 2020.
The National Association of Realtors® is America’s largest trade association, representing more than 1.4 million members involved in all aspects of the residential and commercial real estate industries.
# # #
For local information, please contact the local association of Realtors® for data from local multiple listing services (MLS). Local MLS data is the most accurate source of sales and price information in specific areas, although there may be differences in reporting methodology.
NOTE: NAR’s Pending Home Sales Index for March is scheduled for release on April 29, and Existing-Home Sales for April will be released May 21; release times are 10:00 a.m. ET.
1 Existing-home sales, which include single-family, townhomes, condominiums and co-ops, are based on transaction closings from Multiple Listing Services. Changes in sales trends outside of MLSs are not captured in the monthly series. NAR rebenchmarks home sales periodically using other sources to assess overall home sales trends, including sales not reported by MLSs.
Existing-home sales, based on closings, differ from the U.S. Census Bureau’s series on new single-family home sales, which are based on contracts or the acceptance of a deposit. Because of these differences, it is not uncommon for each series to move in different directions in the same month. In addition, existing-home sales, which account for more than 90% of total home sales, are based on a much larger data sample – about 40% of multiple listing service data each month – and typically are not subject to large prior-month revisions.
The annual rate for a particular month represents what the total number of actual sales for a year would be if the relative pace for that month were maintained for 12 consecutive months. Seasonally adjusted annual rates are used in reporting monthly data to factor out seasonal variations in resale activity. For example, home sales volume is normally higher in the summer than in the winter, primarily because of differences in the weather and family buying patterns. However, seasonal factors cannot compensate for abnormal weather patterns.
Single-family data collection began monthly in 1968, while condo data collection began quarterly in 1981; the series were combined in 1999 when monthly collection of condo data began. Prior to this period, single-family homes accounted for more than nine out of 10 purchases. Historic comparisons for total home sales prior to 1999 are based on monthly single-family sales, combined with the corresponding quarterly sales rate for condos.
2 The median price is where half sold for more and half sold for less; medians are more typical of market conditions than average prices, which are skewed higher by a relatively small share of upper-end transactions. The only valid comparisons for median prices are with the same period a year earlier due to seasonality in buying patterns. Month-to-month comparisons do not compensate for seasonal changes, especially for the timing of family buying patterns. Changes in the composition of sales can distort median price data. Year-ago median and mean prices sometimes are revised in an automated process if additional data is received.
The national median condo/co-op price often is higher than the median single-family home price because condos are concentrated in higher-cost housing markets. However, in a given area, single-family homes typically sell for more than condos as seen in NAR’s quarterly metro area price reports.
3 Total inventory and month’s supply data are available back through 1999, while single-family inventory and month’s supply are available back to 1982 (prior to 1999, single-family sales accounted for more than 90% of transactions and condos were measured only on a quarterly basis).
4 Survey results represent owner-occupants and differ from separately reported monthly findings from NAR’s Realtors® Confidence Index, which include all types of buyers. Investors are under-represented in the annual study because survey questionnaires are mailed to the addresses of the property purchased and generally are not returned by absentee owners. Results include both new and existing homes.
5 Distressed sales (foreclosures and short sales), days on market, first-time buyers, all-cash transactions and investors are from a monthly survey for the NAR’s Realtors® Confidence Index, posted at nar.realtor.