by admin | Feb 26, 2021 | Blog, Homes, Villas and Condos, New Listing, Property for Sale, Property for Sale in Orlando
Vacation Home in Kissimmee for Sale – 3540 Forest Park Dr 3540 Forest Park Dr, Kissimmee, FL Just Listed Property Video Description Photos Maps & Local Schools Print Follow This Home Kissimmee Homes For Sale Free Home Values Search All Homes For Sale...
by Elsa Soto | Feb 5, 2021 | Blog, Buyers, Homeowners, Renters, Sellers
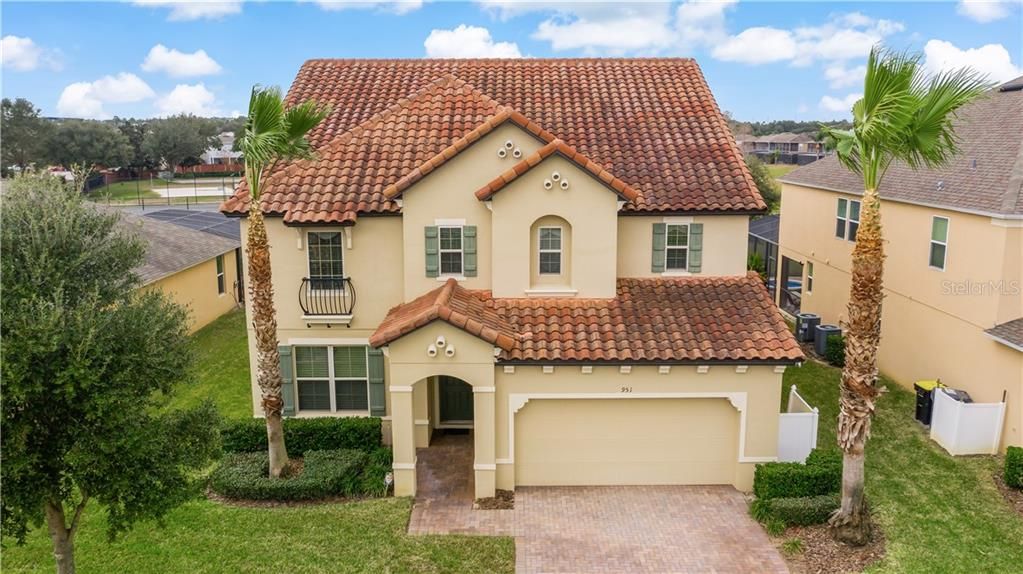
951 Suffolk PL in Davenport FL For sale 951 Suffolk Pl, Davenport, FL For Sale Description Photos Maps & Local Print Follow This Home Davenport Homes For Sale Clermont Homes For Sale Free Home Values Search All Homes For Sale Presented By: Showing Agent: Bardell...
by Elsa Soto | Jan 29, 2021 | Blog, Buyers, Renters, Retirement / 55+
9000 US Hwy 192 #488 Just listed 9000 US Highway 192 #488, Clermont, FL For Sale Description Photos Maps & Local Print Follow This Home Search All Homes For Sale Free Home Values Presented By: Showing Agent: Bardell Real Estate Bardell Real Estate863-424-2309 ...
by Elsa Soto | Jan 22, 2021 | Blog, Mortgages, New Construction, News, Press Releases, Real Estate News
WASHINGTON (January 22, 2021) – December 2020 home sales report rose reaching their highest level since 2006, according to the National Association of Realtors®. Activity in the major regions was mixed on a month-over-month basis, but each of the four areas recorded...

by Elsa Soto | Jan 15, 2021 | Blog, Homeowners, Real Estate Components, Real Estate News, Sellers
Things are coming to a boil in the market for U.S. homes, and it may be the right time to sell.In October, prices for houses across the U.S. registered the fifth-largest monthly gain since 1996 and the strongest in 15 years. The heat is coming from a mix of factors,...