by Elsa Soto | Dec 11, 2021 | Blog, New Listing, Property for Sale, Real Estate Components, Real Estate News, Retirement / 55+
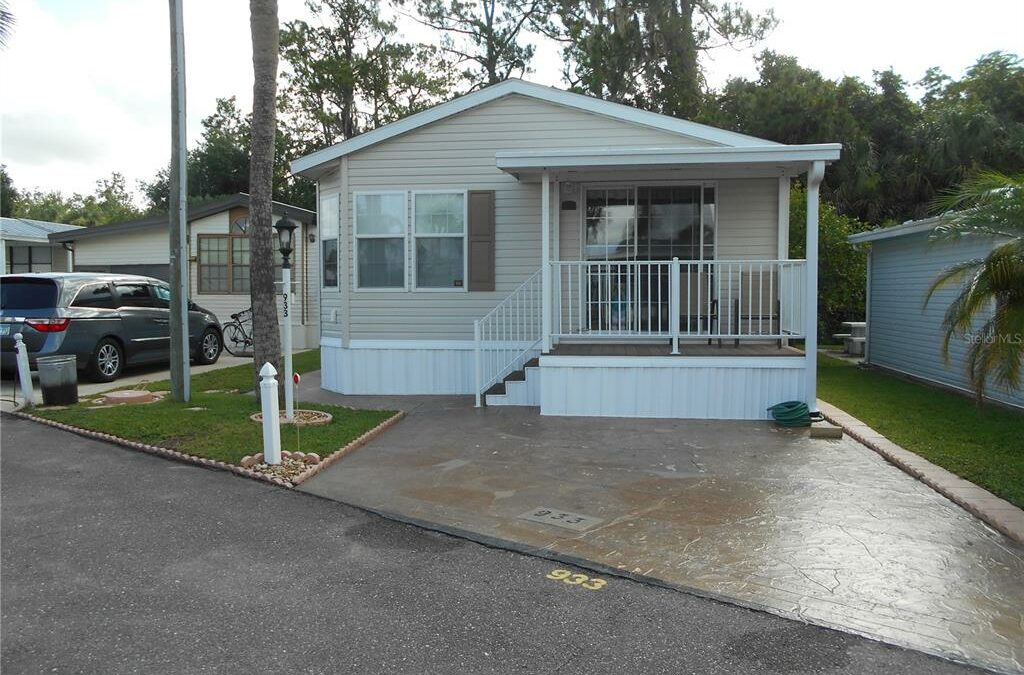
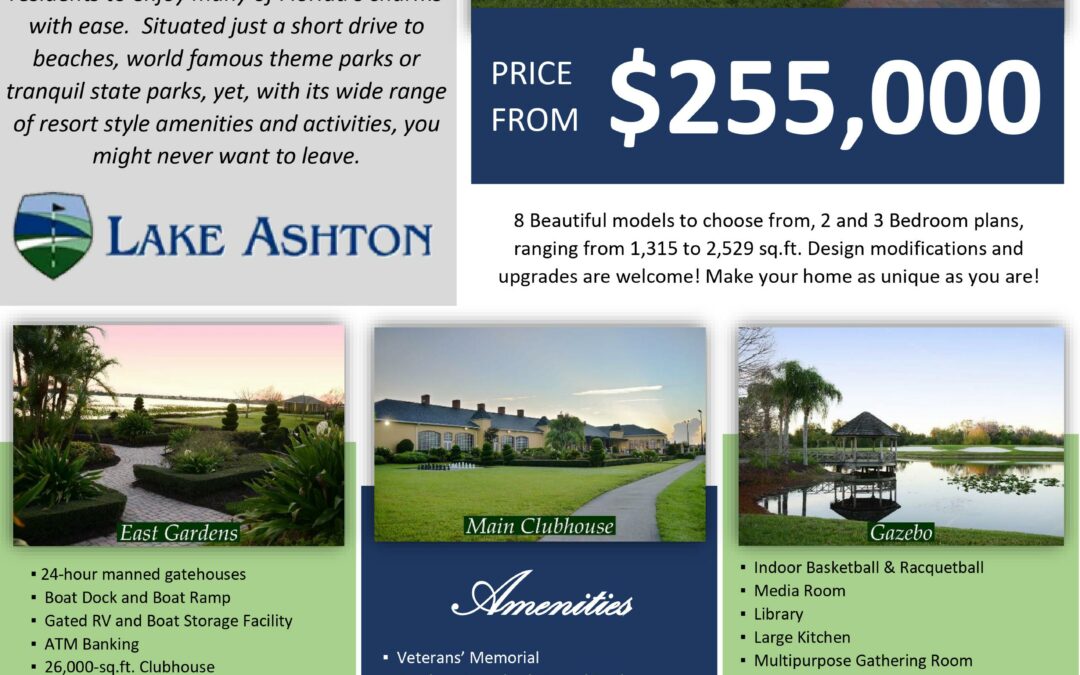
Lake Ashton 55 Plus Community The Lake Ashton master planned community redefines elegance and value in Florida retirement communities. It sets new standards of excellence in design, construction, amenities, lifestyle, location, security and affordability....
by Elsa Soto | Nov 28, 2021 | Blog, Buyers, Homeowners, Homes, Villas and Condos, Investment Property in Florida, Mortgages, New Construction, News, Press Releases, Real Estate Components, Real Estate News, Renters
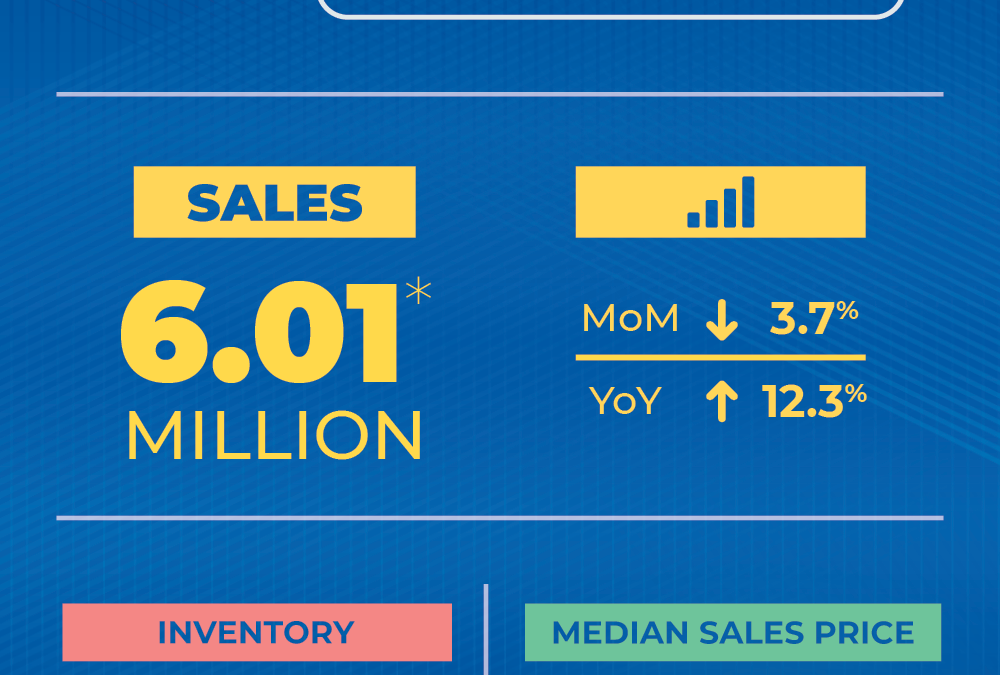
Market in a Min November WASHINGTON (November 22, 2021) – Existing-home sales increased in October, marking two straight months of growth, according to the National Association of Realtors®. Two of the four major U.S. regions saw month-over-month sales climb, one...

by Elsa Soto | Nov 12, 2021 | Blog, Buyers, Real Estate Components, Renters, Sellers
Buying and Selling a home at the same time If you already own a home, the premise of buying another house can be pretty daunting. Do you sell your home first and live in limbo while looking for another, or do you buy now and foot the bill for two mortgage payments...

by Elsa Soto | Aug 4, 2021 | Blog, Homes, Villas and Condos, Real Estate Components
10 Tips for a Winning Offer With housing inventory being at an all-time low there is a great deal of competition when it comes to buying a home. So how do you as a buyer make your offer stand out – well here are ten things to consider to increase the chances of your...
by Elsa Soto | Apr 23, 2021 | Blog, Mortgages, News, Real Estate Components, Real Estate News
Housing Market Report-March WASHINGTON (April 22, 2021) – Existing-home sales fell in March, marking two consecutive months of declines, according to the National Association of Realtors®. The month of March saw record-high home prices and gains. While each of the...