
by Marlayna | Sep 18, 2023 | Blog, Buyers, Homes, Villas and Condos, Investment Property in Florida, Long Term Rental, New Construction, Property Management, Real Estate Components, Renters, Sellers, Theme Parks and Attractions
Get to know more about The Four Corners area Why move to the Four corners area Lake County Location and Geography: Understand the town’s location, geography, and surroundings. Consider factors like proximity to major cities, access to natural amenities...
by Marlayna | May 29, 2023 | Blog, Real Estate News
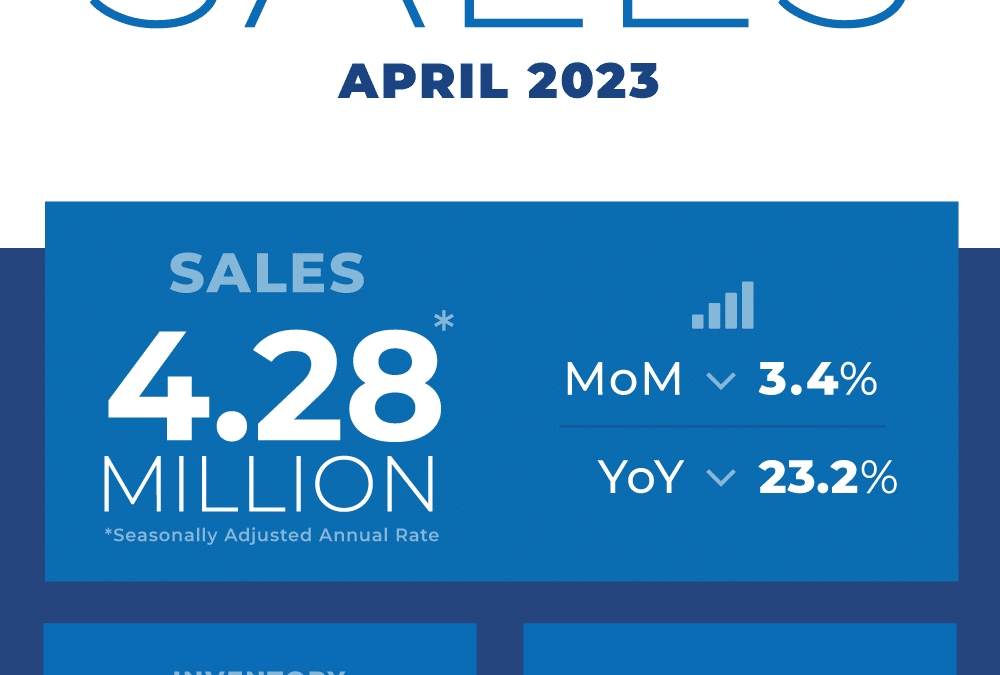
Existing-Home Sales Faded 3.4% in April WASHINGTON (May 18, 2023) – Existing-home sales decreased in April, according to the National Association of REALTORS®. All four major U.S. regions registered month-over-month and year-over-year sales declines....
by Marlayna | Mar 4, 2023 | Blog, Real Estate Components, Real Estate News
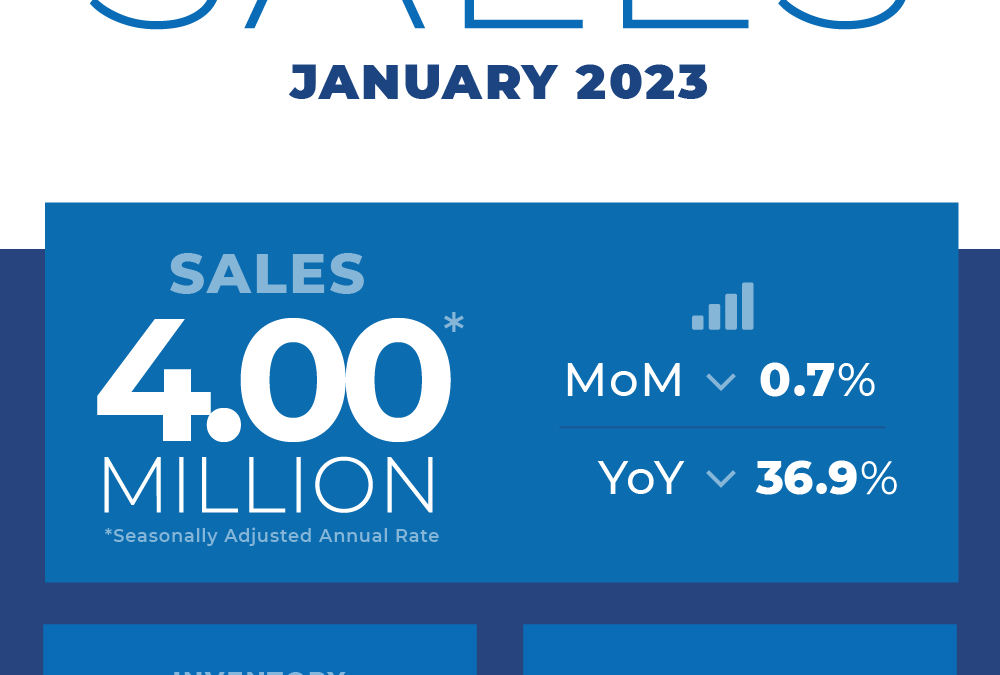
January Real Estate Sales Report WASHINGTON (February 21, 2023) – Existing-home sales fell for the twelfth straight month in January, according to the National Association of Realtors®. Month-over-month sales were mixed among the four major U.S. regions, as the South...
by Marlayna | Mar 3, 2023 | Blog, Press Releases
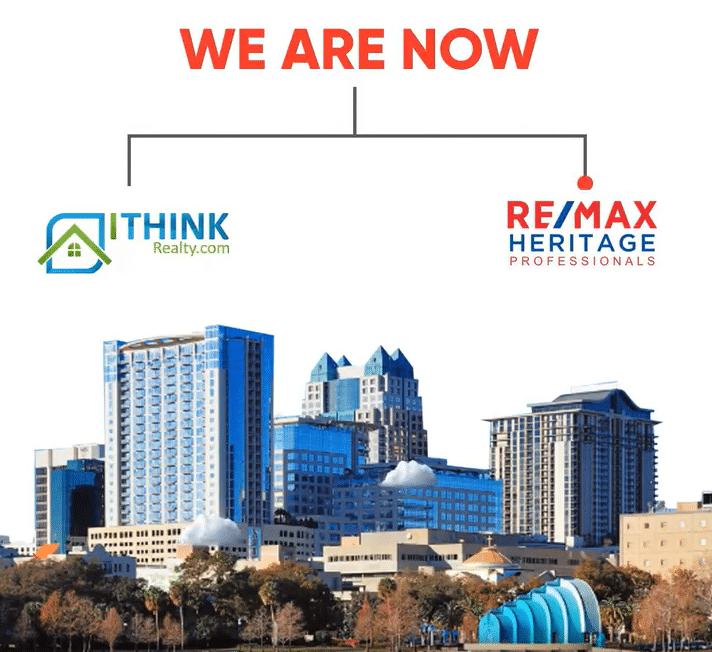
Winter Haven based i-Think Realty converts to RE/MAX Heritage Winter Haven based i-Think Realty converts to RE/MAX Heritage https://www.bardellrealestate.com/wp-content/uploads/2023/03/Remax-Professionals.mp4 Winter Haven, March 1st, 2023— i-Think Realty Broker/Owner,...
by Marlayna | Feb 17, 2023 | Blog, Buyers, Homeowners, New Construction, Retirement / 55+, Sellers
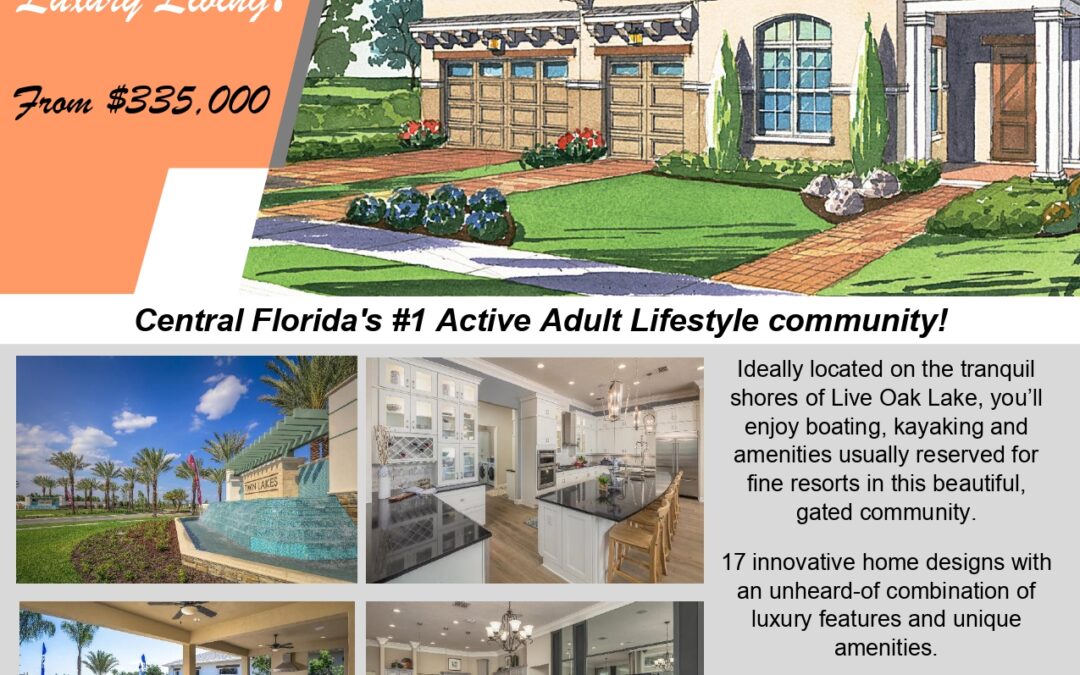
New 55 Plus Community In St. Cloud Central Florida’s #1 Active Adult Lifestyle community is Twin Lakes! With its idyllic location on Live Oak Lake, Twin Lakes offers its residents an array of amenities. The community features an incredible clubhouse, a lakefront...